

MEL & mandated assessments for CSR have been around for a while, and for the most part the majority follow the gold standard OECD-DAC for Impact Assessments. NuSocia has been assessing CSR and other social development programs on the ground for the past 9 years, and through this experience, we have found that CSR program implementation and assessment turn around times to be much, much shorter as compared to NGO run or academic run social development programs. Even with these short time-frames, the need for feedback loops, progress markers, and self-accountability is critical when justifying the need for continued funding or setting up proper exit strategies. With frustrations building over not having enough time to build or report meaningful change in the span of 1-2 years, monitoring, evaluation, and learning must move towards more flexible and progress oriented methodologies. Non-experimental methodologies exist to inform these types of studies. Analysis is a method that allows you to document the progress of a program to show whether it would contribute to a change in the system in the long-run. This takes multiple points of data collection and is extremely useful in showing if the impact is headed the right way with multiple levels of data triangulation to support a theory of change. In this way, documentation can actively work towards showing the potential of a program rather than only fixating on what outputs the program achieved in the short-term.
This case study focuses on NuSocia’s learnings on using contribution analysis in one of the multi-year projects recently
What is Contribution Analysis?
Contribution Analysis is a non-experimental evaluation method that builds evidence on top of a Theory of Change and vets the logic at every step of data collection and discussion. The iteration of the ToC sits at the heart of this methodology and brings in underlying conditions such as the existence of other programs, issues with geography, and other contextual factors. It is not determining causation but at what level did the programme plausibly contribute to it, and how.
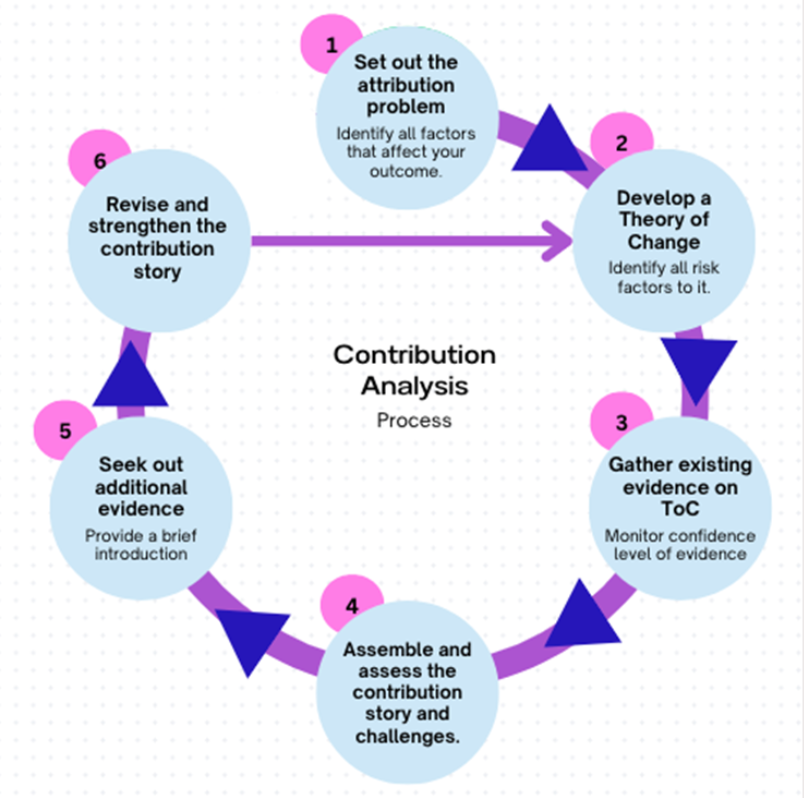
It works from a Theory of Change (ToC). Each step in the pathway, from activities to outcomes, is tested against evidence from multiple evidence sources. Other actors and factors that may also explain the change are examined along the way. The result is a contribution story.
For this particular program, it was critical in the way NuSocia chose to set up the Theory of Change using Matter of Focus’ Theory of Change to measure mental model shifts to behavior shifts rather than trying to measure input to output to outcome.
Instead the Matter of Focus Theory of Change breaks it down into smaller bites:
The idea here is to follow a person’s change in sentiment to active behaviour change. This means learning, to change in thought, to behavior change. The behavior change will result in an outcome. However, long-term systems change again will take time to measure in systemic metrics so this Theory of Change is meant to draw the contribution story of long-term outcomes to associated impact.
Input ⇒ (2) Activities ⇒ (3) Who With ⇒ (4) How do they feel ⇒ (5) What do they gain? (tactile gains) ⇒ (6) What do they learn ⇒ (7) What do they do differently (behavior change) ⇒ (8) Resultant Outcome
Why does it work for CSR projects
CSR programmes rarely run in isolation and that’s a good thing. They sit alongside NGO work, government schemes, other funders and community institutions. Many CSR programs fund supporting activities such as capacity building or bridging of marginalized communities to existing government schemes. Attribution to one funder often oversimplifies what happened and contribution analysis is built for that setting.
| Criterion | Good fit |
| Funding model | Funder supports an existing NGO programme, or co-funds with others |
| Actor landscape | Several actors influence the same outcome (e.g. health services, frontline workers, schemes) |
| Evaluation question | How and why is change happening? What is working, what is not? Triangulation for a mixed methods data collection. |
| Programme stage | If the baseline is missing, a minimum of two data points over time can create a contribution story. |
| Pathway | Multi-step behaviour change (knowledge → attitudes → practice) |
| Counterfactual | No feasible control or comparison group is present, the data collection methodology builds in inquiry to other contributing factors as well. |
| Evidence base | Survey data, qualitative data, programme records and stakeholder views can be combined |
| ToC readiness | A credible ToC exists, or there is time to build it with the partner |
Our Learnings in Contribution Analysis
In this assignment, we started using the Contribution Analysis for a mid-line assessment. In the future, we will also be conducting an endline assessment of the same project. The following were our key takeaways from the first leg of the analysis, which was the mid-line assessment.
What worked
| Fit of the method | The NGOs were already running programmes with several funders, and the CSR Funder wanted to know what its own support added and how it fit with government schemes. |
| Four-step reporting | The report captured the following: expected changes from the ToC → what was being implemented → quantitative trends checked against qualitative data → likely contribution, with enabling factors and bottlenecks. The funder saw this as “the success of our assessment.” |
| Behavior-focused ToC Template | The detailed behaviour-change ToC did its job. It showed where funders and partners should put more effort. Example: Tablet awareness was above 90–95% because local resource persons kept attendance high in community meetings. But few beneficiaries actually took the tablets, and the qualitative data showed why: forgetting, misconceptions and physiological issues. This helps pinpoint exactly where the shift from learning to practice is breaking down. |
| Data Triangulation & Scoring of Evidence | Triangulation supports the pathway, not just the finding. Survey data showed what changed. Qualitative data explained why. Programme records and stakeholder views confirmed whether the activities behind it actually took place. A contribution claim was stronger when these converged, and weaker when they did not. With more than one source of data, this brought credibility and belief into the contribution story. |
| Incorporating REECIS (to some extent) | To account for aspects that move beyond implementation progression and change, we included questions and indicators for REECIS parameters as well. Certain indicators for efficiency, effectiveness, and impact came directly from the evidence from the ToC itself. However, for Relevance and Sustainability (ownership and financial sustainability), collecting separate data was key. For one of the implementation partners, a separate 1–2 page sustainability section drawn from the qualitative data was extremely useful. |
What didn’t work
| Scoring each REECIS parameter | In order to mimic progress, REECIS parameters were scored out of 10. However, scores like 3/10 felt judgemental rather than diagnostic. They discouraged funders, didn’t help partners course correct, and sometimes contradicted the contribution findings. The numbers pulled funders and partners into side discussions away from the nuances of the contribution story. Mitigation & Learning: Focus on TOC and progress on the ground at midterm, and build recommendations. Leave the REECIS scoring for the impact assessment. |
| ToC built without partner input | The funder wanted the detailed ToC hidden so partners wouldn’t be biased. So the team built it from documents, which caused misunderstandings, especially with differing definitions of outputs and outcomes, and needed several rounds of revision. Mitigation & Learning: Built in time at the beginning to build the ToC without indicators with the partners to ensure clarity and seamless data collectionAt the end of the day, the evidence is only as good as the ToC behind it. The following issues stemmed from this one problem area. |
| Missed stakeholders (TOC without input challenge) | The team assumed frontline workers ran sessions directly when in fact the partners’ own trainers did. The trainers were therefore not interviewed and the tool questions didn’t fit. This only came to light about three-quarters of the way through data collection. |
| Tools too long (TOC without input challenge) | There were 100+ indicators across qualitative, quantitative and observation tools, while partners were tracking only a few. Agreeing to indicators with partners first would shorten the tools and ease data collection. |
| Methodological communication with Partners | Partners treated the midline as an impact assessment and saw contribution analysis as a test of performance. Though the team mentioned that this was to support improvement at midline, communication of the methods and final outputs, with tact and diplomacy, becomes key here. |
Moving Ahead in CSR MEL
From these learnings, we identified that in contribution analysis, a shared language that was easy to view and understand was extremely important. The method also helped focus on the slow intermediate changes that are required for long-term change and the triangulation of data to show mental model shifts, something far harder to create than outputs.
If you are interested in learning more about evaluation methodologies for CSR programs, reach out to us at research@nusocia.com!